Aug 11, 2026
Eurex
Focus on VSTOXX® Derivatives: July 2026 Recap
Executive Summary
European markets were positive in July, with the STOXX Europe 600® setting the pace, up 1.16%. The German DAX Index® was the clear winner, up 2.53%, while the EURO STOXX 50® lagged, up 0.47% (47 basis points). All markets outperformed global stock indices.
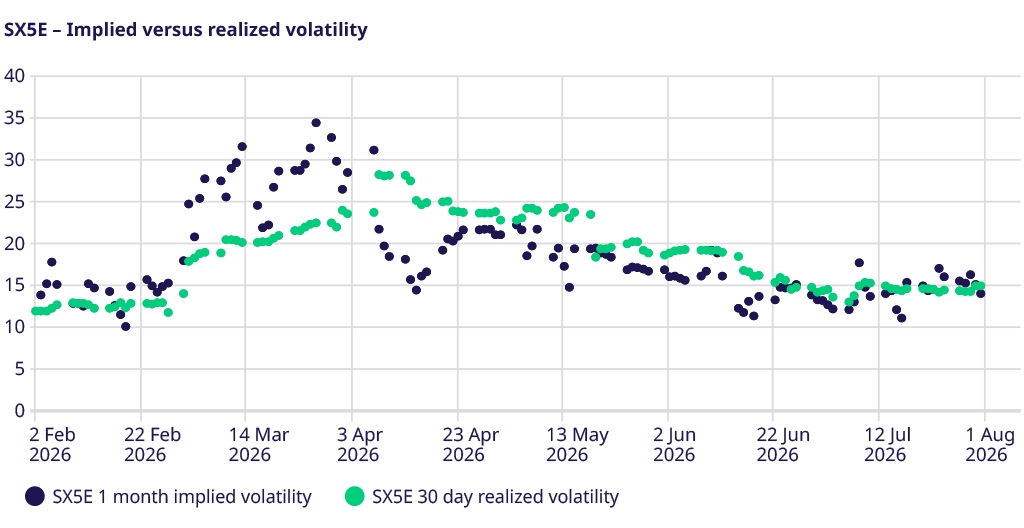
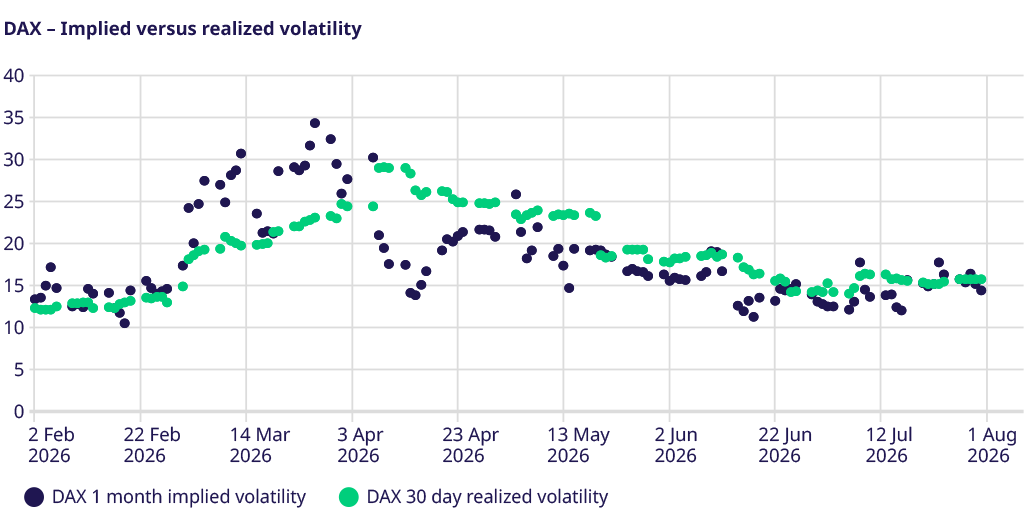
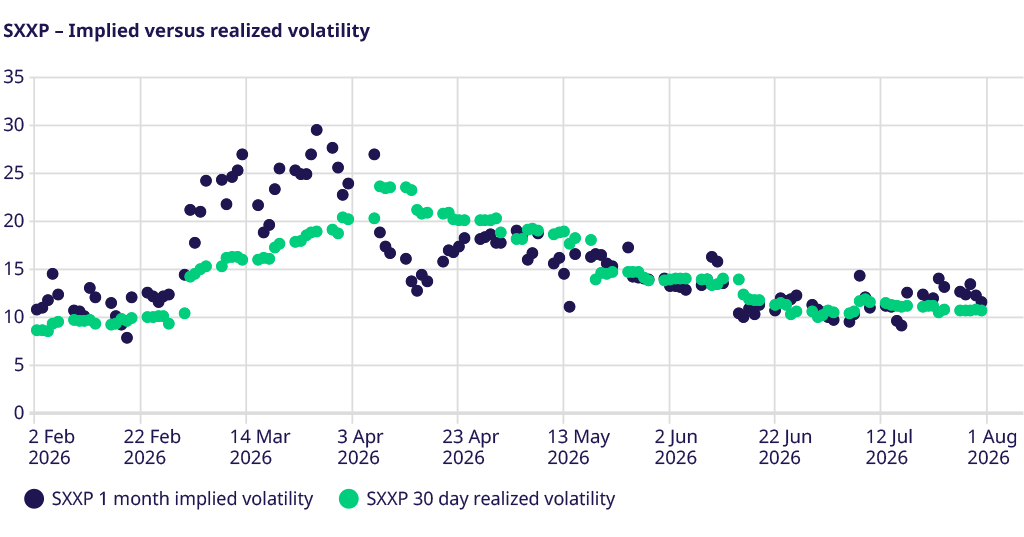
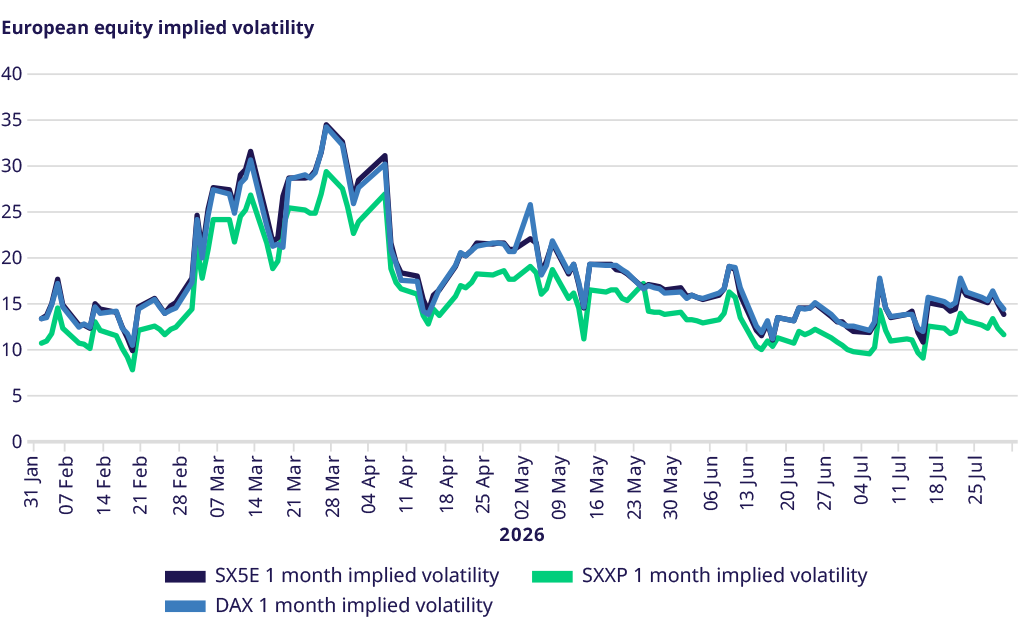
Implied volatility rose slightly over the course of the month despite stronger underlying equity markets. EURO STOXX 50 Index implied volatility rose from 13.08 to 13.83, STOXX Europe 600 Index implied volatility rose from 10.85 to 11.64, and German DAX Index implied volatility rose from 13.11 to 14.42.
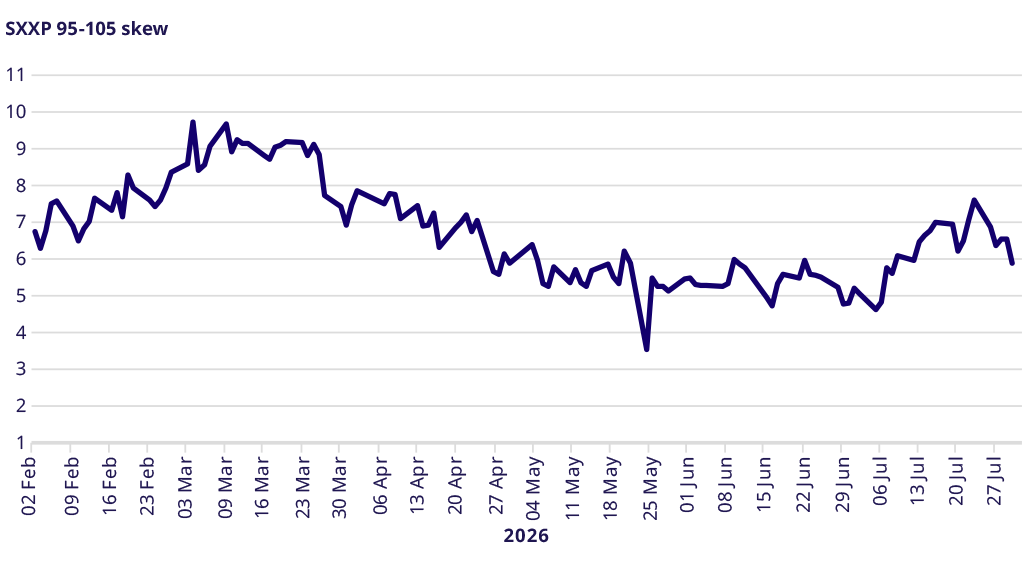
Skew closed a full vol point higher, rising from 4.8 vols to 5.9 vols, though it is still lower than the average skew over the past 12 months.
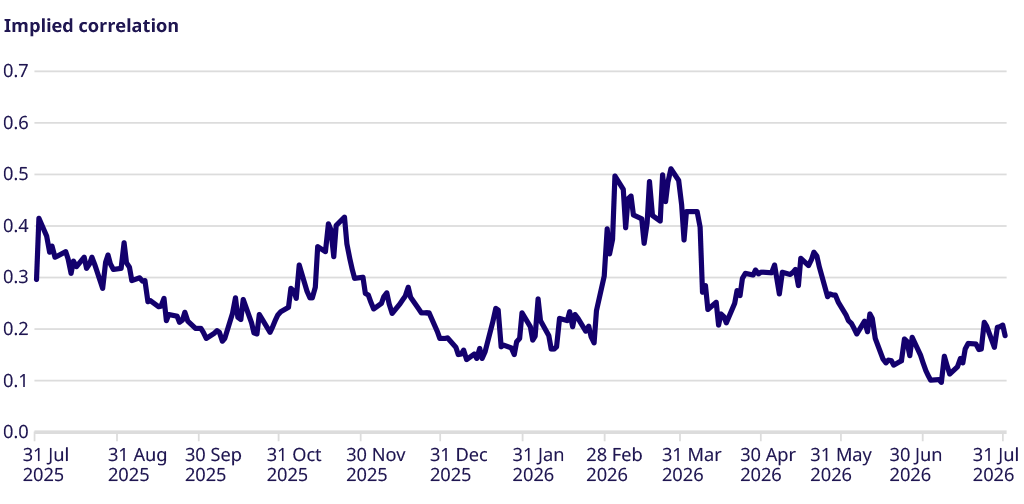
Implied correlation hit 12-month lows below 10% early in the month but proceeded to more than double to 21% before settling at 18.76%.
Equity Index Volatility
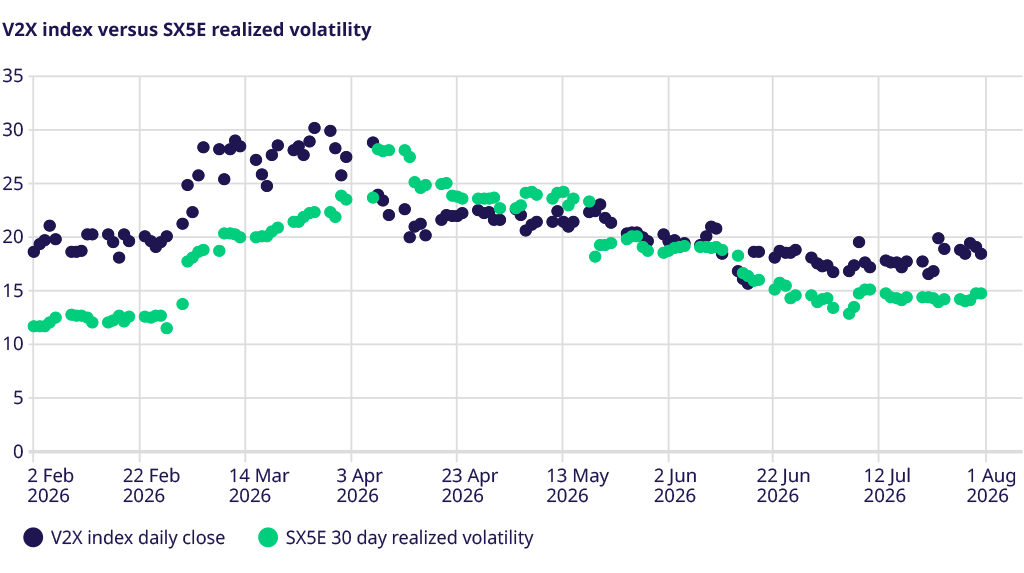
Stronger equity index markets did not put a damper on volatility markets in July, as implied volatility rose over the course of the month, driven by higher realized volatility. EURO STOXX 50 implied volatility rose to 13.83 at the end of July, still at a discount of one vol point to 30-day realized volatility of 14.81, the same discount as at the end of June. DAX Index implied volatility rose to 14.42, at a discount of more than one vol point to trailing realized volatility of 15.69. STOXX Europe 600 implied volatility of 11.64 was higher than the 10.85 level recorded at the end of June and higher than the 10.76 realized volatility.
VSTOXX® Index Performance
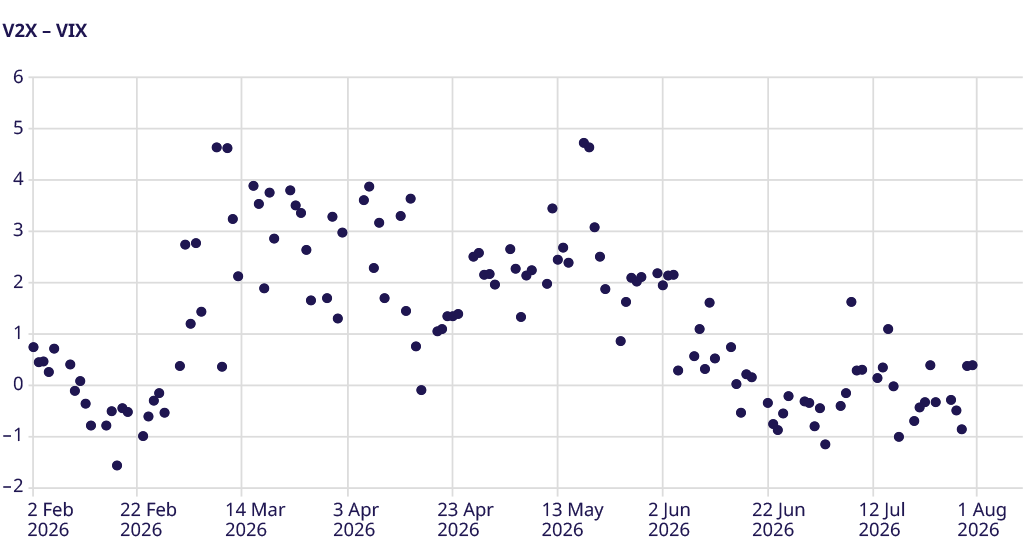
The VSTOXX® volatility index was higher over the course of the month, rising from 17.6 to 18.5, but it remained below the highs of 19.9 seen during the month. The premium of VSTOXX® to EURO STOXX 50 realized volatility ranged between 3 and 5 vol points and closed the month at 3.7 vol points, reflecting the skew and kurtosis in the market, as at-the-money implied volatility was at a discount.
STOXX Europe 600 Index Skew
Hedging demand over the course of the month may have led to higher skew in July, with the 95%-105% implied volatility differential rising to 5.9 vols from 4.8 vols. While higher month over month, this level is below the 12-month average skew of 6.5 vols and below the monthly high of 7.6 vols, reflecting a late-month rally in the underlying stock market.
Correlation
Implied correlation closed June at 52-week lows of 13.56% but then proceeded to hit new lows in early July, falling below 10%, the lowest level in the last 15 years. It doubled off the lows to hit 21% before closing the month at 18.76%, still low by long-term historical standards but up sharply from recent low levels.